
Description
An ECG signal simulator (electrocardiogram) is an electronic and software tool that artificially generates known, reliable and repeatable electrical signals that represent cardiac electrical activity, in order to periodically evaluate the operation of electrocardiographs and cardiac monitors. Here you will find some necessary information to build a very low-cost portable ECG signal simulator, based on easy-to-acquire electronic components, of simple construction and capable of evaluating modern monitors that have, for example, real-time arrhythmia detection and recording functions. of variations of the ST segment. The design is based on a portable PC or smartphone responsible for generating the waveforms of the signals to the equipment under test. These signals may come from a bank of signals that represent specific heart disease or they may be the calibration signals recommended by international standards to test this type of equipment. This work was carried out and presented as an initial research project at the Autonomous University of Entre Ríos, Faculty of Science and Technology (UADER - FCyT) in Concepción del Uruguay, Entre Ríos Argentina.
To achieve the goal of very low construction cost while maintaining the quality in terms of signal reproduction, the simulator uses a portable PC or a mobile phone together with an electronic board based on a few components. The PC or the phone run an application with minimum requirements of SW and HW capable of storing, visualizing and reproducing through its sound interface (audio board) the ECG signals, and the electronic board is responsible for conditioning the amplitude of the signals at millivolt levels.
The simulator could be seen as a simple audio signal player followed by a resistive attenuator to condition the signal amplitude levels; although in principle this is so, if the spectral composition of the ECG signals is taken into account, rich in very low frequency components as can be seen in the power spectral density (PSD) graph of Figure 1, that the higher concentration of frequency components is found before 10 hz, and considering the limitation that sound interfaces have in reproducing this kind of signals as can be seen in Figure 2 that below 10 hz the amplitude response vs. The frequency of the sound plates of some phones has a considerable attenuation, so to be able to reproduce ECG signals as simple audio files, this limitation must be overcome by performing a signal processing prior to playback.

Fig. 1. ECG Record 16273, Normal Sinus Rhythm, Fs: 128 Hz, MIT Boston's Beth Israel Hospital.
Fig. 2. Frequency response of the audio interface of some cell phones.
Fig. 3. PSD of the carrier signal modulated by the ECG signal of Figure 1.
Fig. 5. Screen capture of GW Instek GDS-1062A oscilloscope during a simulation.

Fig. 6. Graph of instantaneous frequency vs. input. output voltage of the simulator board and straight data regression.


The low frequency amplitude attenuation of the sound interfaces causes the low frequency components present in the ECG signal to be strongly attenuated and the waveform to be reproduced to be distorted. That is why, prior to reproduction, a frequency shift of the entire ECG signal spectrum was performed by modulating with the information of the ECG signal the instantaneous frequency of another carrier signal of about 4khz that does not suffer distortion due to attenuation when reproduced because it is located in the flat response zone of the audio interface. In this way the PC or telephone reproduces an audio file with this frequency-modulated carrier signal (FM) that carries the ECG signal information printed, then it is the electronic board of the simulator, which is linked with an audio cable with the PC or telephone, which must recover (or demodulate) that information and fit the levels of electrical voltage that must be in the order of millivolts.
The modulation process is carried out by means of a digital signal processing, it is not done in real time because it would require another level of HW and SW resources, it is done prior to reproduction through an algorithm performed in Octave, that means the signal is prepared before using, taking care that the bandwidth of the modulated carrier signal is always within the flat response zone of the audio board, this is achieved by limiting the value of the frequency shift coefficient to about 800 Hz / mV as can be seen in Figure 3 where the power spectral density of this signal modulated by the ECG signal of Figure 1 is plotted. This signal is then converted into a digital audio file ready to be reproduced. On the other hand the de-modulation process is carried out in a totally analog way on the electronic board of the simulator, by an FM demodulator PLL circuit followed by an active Butterworth low pass filter order 7. A conceptual scheme of the simulator can be seen in Figure 4.
The choice of using an analog communication instead of a digital one, for example, by sending the digital signal through the USB port from the PC or phone that reproduces the ECG signal to the electronic board that conditions the amplitudes, is because of this This way you can use low-cost phones that do not have the necessary USB OTG (On-The-Go) technology in the case of sending the data from this device to a board with a microcontroller with a D / A converter. In addition to the fact that component costs are somewhat lower in this analog version, manufacturing the electronic interface has a cost of around US$ 6, this is manufacturing the PCB at home because it was designed to be very simple.

Fig. 4. Conceptual block diagram of the ECG simulator.
A prototype application was developed in Java language for PC, through which the user selects from a list the audio files corresponding to the ECG signals to be used, the application displays a graph on the screen of the original ECG signal and plays the selected signal through the audio port; In addition, the application shows a text box with the particular characteristics and parameters of the signal that must be detected by the equipment under test. A set of signals was prepared to recommend the ANSI / AAMI EC13: 2002 standard "Cardiac Monitors, Heart Rate Meters, And Alarms" [2], these signals include both synthetic and real waveforms. For details on these test waveforms and how to use them, see section 5.1.2.1, paragraphs (e) and (g) of that standard.
The electronic interface of the simulator was connected to the analog audio output port of a PC on which the SW application was installed, a Nihon Kohden monitor was connected to the electronic interface, where the accuracy in the heart rate measurement was verified and the response to irregular rhythms according to section 5.1.2.1 subsection (e) of the ANSI / AAMI Standard mentioned, it was also tested according to subsection (g) of this standard where the time for alarm activation by tachycardia is evaluated, both with results favorable. As an example in subsection (e) of these tests, it is requested to reproduce a real ECG signal with ventricular bigeminism, signal “aami3a”, which can be obtained from the Physionet database [8], this signal has a total duration of double complex of 1500 ms, a rhythm of 80 bpm if all QRS complexes are counted or 40 bpm if only the largest R waves or S waves are counted, which the equipment under test must detect.
Concerning to the calibration of amplitudes of the signals to be reproduced, in this simulator, only derivation I can be calibrated, the rest of the derivations are scaled reproductions of this derivation. To perform the calibration, a signal consisting of a pulse train of amplitude 1 mVpp with a very low frequency and 50% activity cycle is generated through the application of SW, which has a period of 4 seconds which leaves enough time to make an adjustment on a variable resistance in the electronic interface while measuring on the lead I with a voltmeter instrument. This simulator has an output to connect an oscilloscope, a simulation in progress of the signal used in Figure 1.

The electronic interface converts frequency variations of the carrier signal into amplitude variations (ECG signal) and this frequency and voltage relationship must be linear. A linearity test was performed in Figure 6, where comparing the response of the simulator with its regression line gives a maximum linearity error of 1.35% between carrier frequency snapshot values of 1 Khz and 7 Khz. As for the dynamic response of the simulator, the loop filter of the PLL was adjusted and the filter passes low output with a cutoff frequency of 150 Hz sufficient to simulate a large number of ECG signals.
Schematic circuit of the electronic interface
CALIBRATION PROCESS / METHOD:
A voltmeter must be connected to the millivolt scale, in branch I (between P4 and P5) and through the application of SW play the calibration file, this file generates a calibration signal that is a very low square pulse train frequency. The calibration pulses are 4 seconds long, 2 seconds the signal will be high and 2 seconds low, with a difference in amplitude of 1mV peak to peak. With the voltmeter connected in lead I, preset RV1 must be adjusted until a reading of 1mV of difference between the high and low state of the pulses is obtained. For example, during the low state it can measure 4.6mV and during the high state 5.9mV, this means that there is a difference of 1.3mV peak to peak, therefore the preset must be adjusted until the difference is exactly 1mV. Remember that the only derivation that will be calibrated is derivation I.
CONSTRUCTION OF THE PRINTED CIRCUIT:
The printed circuit board can be sent to be manufactured or built in a homemade way, the printed circuit is double-sided but bridges made with cables or wires can be used, they are the red tracks of Figure 10 which is a view of the board From below, the homemade construction can be done using the “iron method” and then make the bridges with cables as seen in the photo in figure 12. The plate can be installed inside a cabinet together with the battery and a key for ignition as can be seen in Figure 13. In this case a 3.5mm "audio jack" was used for the signal input. In the download section at the bottom of the page you will find the entire projectwith the KiCad files.

Fig. 9. Location of components.

Fig. 10. View from below of the printed circuit board.

Fig. 12. View of the cable bridges from below the PCB
The circuit consists of an FM demodulator using a PLL [11] followed by an analog Butterworth lowpass filter, the circuit can be seen in Figure 7 and Figure 8. It is very simple, the modulated carrier that was generated by the application of SW on the PC and leaves from the audio port, enters P6 to the HEF4046 and its phase is compared with the VCO signal that is configured at a frequency free of about 4 kHz, (R16 and C11 set this frequency) any phase difference (or frequency) can be seen at the output of the comparator as a pulse train of proportional width to this difference, on pin 2 (PC1), therefore The average value of this pulse signal contains the phase difference (or frequency) information and in this difference the ECG signal information modulates the audio carrier. The average value is obtained by applying this signal to an RC low pass filter formed by R14 and C12 and enters as input signal to VCO pin 9. This same signal internally passes through a buffer transistor and is available in pin 10, it is the ECG signal. which should be further filtered by the Butterworth filter which is a filter of order 7 of good selectivity and good flatness in the pass band.
The filter can be seen in Figure 8, it is implemented with an operational amplifier LM324, at the output of the pin 14 filter the ECG signal is taken to see it in the oscilloscope, signal P1 OCR, this signal has a DC component of approximately 1 , 2V and above that level is the ECG signal; To be able to observe the signal correctly, the oscilloscope line must be moved downwards on the screen by adjusting the level of continuous and setting the vertical channel to about 200mV per division, the time base must be around 250mV per division and ideally it must be a digital oscilloscope to see the whole trace of the ECG signal as in Figure 5.
The ECG signal already attenuated by a resistive splitter is available on pins P2 to P5 where the equipment under test is connected (monitor or electrocardiograph), between pins P4 and P5, is lead I, which must be calibrated by adjusting preset RV1 according to the procedure in the next paragraph. Branch II is connected between pins P4 and P3, branch III between pins P3 and P5, and the precordial signals are all obtained between pins P2 and P5. The circuit is powered by a 9V battery.


Fig. 7. First stage schematic circuit - FM demodulation by PLL.

Fig. 8. Second stage schematic circuit - Filter and signal attenuator
Fig. 11. Location of components in the real circuit.

Fig. 13. Image of the simulator in a plastic cabinet.
Software Application


SOFTWARE APPLICATION:
The SW application for PC is a prototype version and is written in Java using Netbeans, you can download the entire project with the source code or just the application and the signals ready to use from the download section at the bottom of the page, to execute it You must download the DIST folder where the executable file ECG_PLL.JAR is located and the files corresponding to the ECG signals to be played. After running the application you can see a list of ECG files to play in the selection list to the right of Figure 12, when selecting a file a reference will appear in the text box on that signal, the signals you will find available are recommended by the EC13 standard and a calibration signal.
In the folder you will find for each signal 3 files, all with the same name and different extension, the .WAV file is the modulated audio file, the .DAT is a file with the samples in “Octave” format to make the graphic of the signal on screen with vertical scale in millivolts and horizontal in seconds, and the .TXT file is a text with the description of the signal that will appear in the on-screen box. The SW application is basically an audio signal player that displays a graphic and a text box with instructions on how to use the ECG signal.

Fig. 12. Second stage schematic circuit - Filter and signal attenuator.
INSTRUCTIONS FOR USE OF THE SOFTWARE APPLICATION:
After performing the simulator calibration according to the procedure mentioned above, you can select the available signals, these signals are useful to test the electrocardiogram function of a patient monitor equipment according to ANSI / AAMI EC13, we will see some examples of use later.
High T waves can affect the detection of QRS and double the heart rate, the ANSI / AAMI EC13 standard in section “5.1.2.1 Disclosure of performance specifications” section c) “Tall T-wave rejection capability.” (rejection of high T waves) indicates a method to check the maximum value allowed in millivots of the T waves declared by the manufacturer so that a double count in the rhythm does not occur. It consists of reproducing a signal as indicated in Figure 13 with 1 mV amplitude of the QRS complex, with 100 ms duration, and 80 bpm, the amplitude of the T wave will be increased in jumps of 0.2 mV every one minute to an amplitude of 1.2 mV then with the highest value declared by the manufacturer of the T wave the indicated rate should be 80 ± 8 bpm. The text of the standard can be seen in Figure 14 and a specification statement from two monitor manufacturers can be seen in Figure 15. Figure 16 shows the simulated signal in a T-wave height transition from 0.2 mV to 0.4 mV 60 seconds after its start.
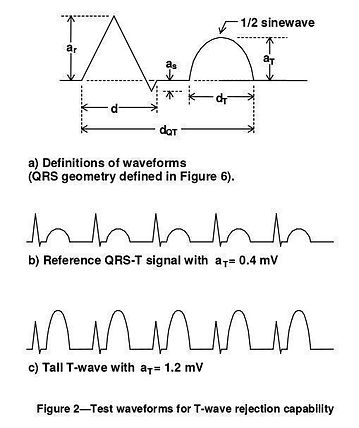
Fig. 13. ANSI / AAMI EC13 waveform to test the ability to reject T waves
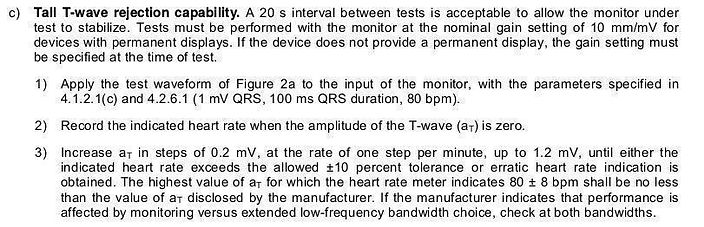
Fig. 14. ANSI / AAMI EC13 procedure to test the capacity of T wave rejection
Fig. 15. Patient monitor specification statement “Epsimed CMS 8000” (left) and “Philips Efficia CM Series” (right).

Fig. 16. Signal generated by the simulator according to ANSI / AAMI EC13, height transition view of the T wave from 0.2 mV to 0.4 mV at 60 seconds from its start.
Let's look at a second example: In the same section 5.1.2.1 of the standard but in part e) “Heart rate meter accuracy and response to irregular rhythm” it is indicated how to test the accuracy of the equipment in the measurement of rhythm against irregular rhythms which must reproduce the 4 signals, 3a, 3b, 3c and 3b that are seen in Figure 17, and the equipment under test must indicate the rhythm that it declares in its specifications manual, in Figure 18 you can see the statement referred to this test of 2 teams from different manufacturers.
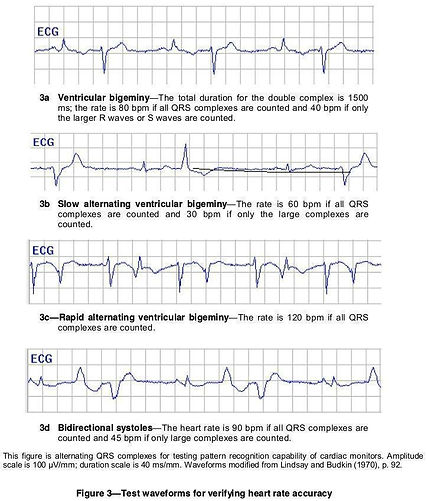
Fig. 17. ANSI / AAMI EC13 waveform to test the accuracy of the heart rate measurement.
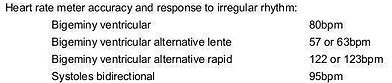
Fig. 18. Patient monitor specification statement “Epsimed CMS 8000” (left) and “Philips Efficia CM Series” (right).
Use of the simulator with a “Smartphone”:
At the moment, an Android application capable of running on a Smartphone is not finalized but the phone can be used as a signal simulator next to the electronic interface. To achieve this, all the .WAV audio files must be copied to a folder in the phone's memory (it can be in an external SD memory) and then with an audio file player select the one required for the test. You must connect the simulator interface with the same audio cable used for PC and increase the volume of the phone to the maximum. A list of files using the “VLC for Android” player can be seen in Figure 19.

Fig. 19. List of modulated audio files with ECG signals to play on a Smartphone.
Generation of the files with the ECG signal:
As it was seen in a previous section, each ECG signal has 3 associated files, a text .TXT file, a .DAT file with samples in “Octave” format, (after a 5-line header they are samples in ASCII format separated by a space), and an audio .WAV file, all of them with the same name and different extension. The .DAT file are samples of an ECG signal that was sampled at a frequency of 720Hz, this sampling frequency "fs" must be respected as it is used to graph the signal by the SW application.
The files are generated using the GNU Octave platform, the ECG signal can come from any digitized format with an fs = 720hz that can be read and loaded into memory in the Octave environment, in memory the data is part of a data vector that they must be saved in a file with a .DAT extension using the “save” command, for example if the signal was loaded into memory in the variable “ecg” the line: >> save ("data.dat", "ecg"), create a "data.dat" file with the required format, in Figure 20 you can see a part of the file, this file is ready to be used by the SW application and processed by an Octave script to generate the .WAV.

Fig. 20. File with samples in Octave format.
Once the .DAT file is obtained, the .WAV modulated audio file must be generated, this is achieved by modulating with the ECG signal information a 4kHz audio carrier signal for which the signals must be processed as shown in the Figure 21 equation, general expression of a carrier modulated in frequency by a signal m (t), this is achieved by modifying the instantaneous phase of this carrier cos (wct) by adding the instantaneous phase that delivers the integral term, the modulating signal m (t) in our case it will be the ECG signal, Kf is the frequency shift coefficient that was chosen in 2 * π * 800 [rad / mV] factor that controls how much the carrier's instantaneous frequency will deviate for every millivolt of amplitude of the ECG signal To perform this modulation process in digital form, an unmodified carrier signal must be created with a sampling frequency several times greater than the 4kHz carrier frequency to avoid the overlapping effect (aliasing), a carrier sampling frequency of fsp was chosen = 22.32Khz, that is, the audio file will have a “sample rate” of 22.32Khz.

Fig. 21. Mathematical expression of a carrier signal modulated in frequency by another signal m (t).
The digital processing carried out using the “FM.m” script in Octave is as follows (you can download it in the download section):
1 - The .DAT file with the ECG signal is read and loaded into memory, then a resampling of this signal is increased, increasing the number of samples to obtain a “sample rate” of 22.32Khz (upsampling) to match the carrier signal
2 - The modulating signal is integrated and multiplied by the frequency offset coefficient.
3 - The frequency modulated signal is created and recorded in an audio file in .WAV format with a sample rate of 22.32Khz and 16-bit samples.
The following figure shows an Octave script that performs the frequency modulation of the carrier signal, in this example the modulator signal is an ECG signal found in a “100m.dat” file, then at the end the “audiowrite ( ) ”Generates the audio file“ 100m.wav ”ready for use with the SW application or run with any audio file player.

Fig. 22. Mathematical expression of a carrier signal modulated in frequency by another signal m (t).
ECG signals obtained from PhysioNet:
Physionet is a web platform supported by the National Institutes of Health (NIH) where you can find various physiological signals including ECG signals, from the following link you can access to a database of signals and select an ECG signal https: / /archive.physionet.org/cgi-bin/atm/ATM.
Let's see an example, from the drop-down menu select:
Database: MIT-BIH Arrhythmia Database
Record: 100
Signals: V5 (select only one signal, do not use the “all” option)
Length: 1 min
Then select Toolbox: “Plot Waveforms” below you can see the electrocardiogram. To download the file and use it in the simulator select Toolbox: “Export Signals as .mat” below you will see some links to download files, you will need to download two of them, one 100m.mat with the signal data and another 100m.info file with information about the signal. Then, from the Octave environment, run the script: plotATM_mp ("100m"), (this script can be obtained from the download section of this page). When executed, the script returns the sampling frequency with which the “.mat” file was generated. , a graph of the signal will be shown and within the folder you will see a file with extension “.dat” created. This is the type of file to use in the simulator.
>> plotATM_mp ("100m")
fs = 360
IMPORTANT: Finally, before ending with this example, note that the sampling frequency in this case was 360Hz, therefore it is not correct and the signal must be re-sampled, for this the plotATM_mp () script is provided in code line 66 a function that performs this task, in this case it must be completed as follows: ecg = resample (ecg, 2,1) in this way the sampling frequency is doubled to a value of 720hz, for other combinations see the documentation Octave on the resample () function.
References and file downloads
1. Bronzino J. (ed.): The Biomedical Engineering Handbook, Vol 1. 2nd Ed. CRC Press LLC. Boca Ratón, USA. (2000)
2. Cardiac monitors, heart rate meters, and alarms [American National Standard (ANSI/AAMI EC13:2002)]. Arlington, VA: Association for the Advancement of Medical Instrumentation (2002)
3. García, A. Simulador de biopotenciales reprogramable basado en microcontrolador 18F14K50 con comunicaciones USB y convertidor D/A por SPI. Universidad Politécnica de Cartagena. (2014)
4. IEC International Standard 601-2-47 Ed. 2 Medical electrical equipment part 2-47: Particular requirements for the basic safety and essential performance of ambulatory electrocardiographic systems, IEC. (2012)
5. Martínez A.E., Rossi E., Nicola Siri L. Microprocessor-based simulator of surface ECG signals. 16 th Argentine Bioengineering Congress, Journal of Physics, doi:101088/1742-6596/90/1/012030. (2007)
6. Mudrov T, Krasteva V, Jekova I. Microcontroller-based ECG simulator prototype, Proceedings of 13 th Int Conf “Electronics 2004”, Sozopol, 22-24 September, 2004;1:86-91.
7. Lathi B.P.: Modern Digital and Analog Communication Systems 3rd Ed., Oxford University Press, Inc. New York, NY, USA. (1998)
8. Physiobank: Base de Datos de señales Biomédicas. Disponible en: https://physionet.org/physiobank/database/aami-ec13/
9. Samuel E. de Lucena. ECG Simulator for Testing and Servicing Cardiac Monitors and Electrocardiographs. IMEKO TC4, Natal, Brazil. (2011)
10. Valais I., Koulouras G., Fountos G., Design and Construction of a Prototype ECG Simulator. e-Journal of Science & Technology. (2014)
11. David K. Morgan, CD4046B Phase-Locked Loop: A Versatile Building Block for Micropower Digital and Analog Applications. Texas Instruments, Application Report SCHA002A. (2003).
Download link:
https://drive.google.com/drive/folders/1XlKwCT_SSgSbY8d8W6ZxGsAOLDHdcYSS?usp=sharing
Octave scripts
SW application in JAVA with several signals.
Source code of the SW application (project in NetBeans).
Files in Kicad and in PDF format of the circuits and PCB.
Copyright Statement:
Solicita un presupuesto gratis - sin compromiso.
Completa el formulario y te contactaremos a la brevedad.
Contact Information
The authors of the project are Ing. Mauricio Pagano, Lic. Luis Graziani and Bioing. Francisco Naveira
For questions or suggestions you can communicate by sending an email to: mauriciopagano@gmail.com
Copyright Statement:
We distribute all our software, firmware, drawings, schematics, and manuals (our 'work') for free under the GNU General Public License. If you modify our work, or include it in your own work, you must distribute the resulting work for free under the same license.
Limited Liability:
The author will not be liable for direct, indirect, special, punitive, incidental or consequential damages, resulting from the use or inability to use the website, content or information.
All content provided on this website is for educational and informational purposes only. The information published on this website may have errors or inaccuracies. The author does not represent or guarantee that the information contained in the site is accurate, complete or updated.
All information, services, products and materials contained in this site, including graphics, text, links to other sites, are provided "as is" without warranty.